REM × BIXI: Causal Impact of Light Rail on Bike-Share Demand in Montreal
TWFE DiD on 48.5M BIXI trip records estimates two REM openings' effect on bike-share demand. Matched estimates: +10.4% and +2.7%. Nearest-neighbor matching revealed 80% of the naive Deux-Montagnes effect was confounding bias from dissimilar controls.
The Question
When a city opens a new rail line, does it increase or decrease bike-share usage at nearby stations?
The question matters for how transit investments get evaluated. If rail complements cycling (enabling multimodal first/last-mile trips), a ridership count understates the network’s true benefit. If it substitutes for cycling, the same count may overstate it.
Montreal’s Réseau express métropolitain opened two segments on different schedules: the South Shore branch in July 2023 and the Deux-Montagnes branch in November 2025. The staggered rollout, driven by construction logistics rather than demand, creates two quasi-independent natural experiments.
Data
~48.5 million anonymised BIXI trip records across all active stations from 2021 through 2026, roughly 13 GB uncompressed. Chunked Pandas reads aggregate the raw trip-level files into a station-week panel of ~124,000 rows.
One nontrivial cleaning step: BIXI renamed and reorganised stations several times as the REM opened. For instance, de la Gauchetière / Mansfield became Gare Centrale then REM Gare Centrale. Naive grouping by name would treat one physical location as multiple entities and break identification. Stations were deduplicated by geographic coordinates, reducing 1,880 name variants to 1,688 physical locations.
Matching
BIXI stations near new REM stops are structurally different from typical stations; they tend to be high-activity transit nodes. A naive DiD comparing all treated stations to all available controls picks up that pre-existing difference, not the treatment effect. To address this, each treated station was matched to its five nearest neighbours (k=5) on standardised log pre-period trip count, latitude, and longitude.
Matching cut in opposite directions for the two events:
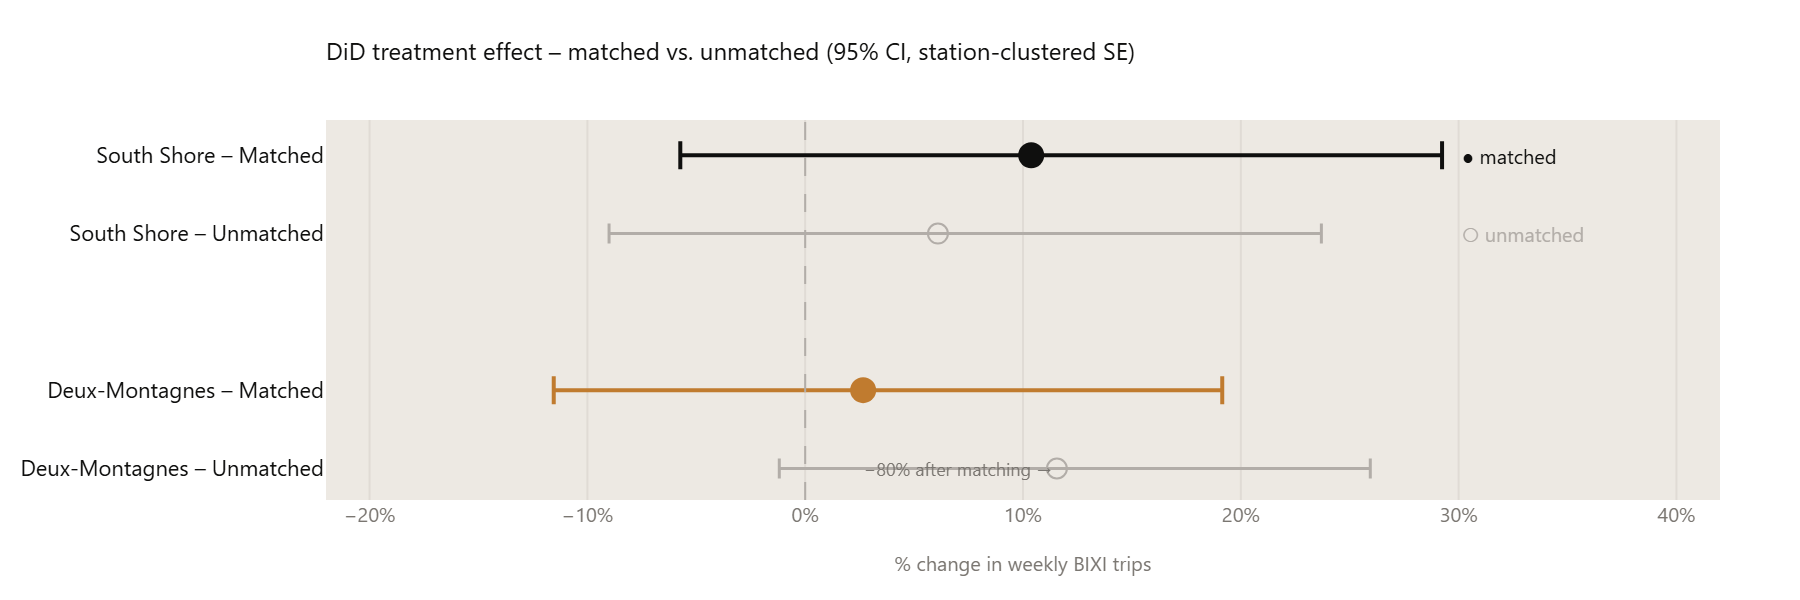
Deux-Montagnes: The naive estimate was +11.6%, approaching conventional significance (p=0.077). After matching, the estimate fell to +2.7% (p=0.73). Roughly 80% of the apparent naive effect was confounding bias from comparing downtown treated stations against dissimilar far-flung controls.
South Shore: The naive estimate was +6.1%. After matching, it rose to +10.4% (p=0.22). Here, heterogeneous controls in the naive specification were diluting a possible real effect by pulling the comparison toward dissimilar low-activity stations. Matching to comparable controls produced a larger estimate.
Estimation
Two-way fixed effects DiD:
log(trips_it + 1) = α_i + λ_t + β · (treated_i × post_t) + ε_itStation fixed effects α_i absorb time-invariant differences between stations. Week fixed effects λ_t absorb common shocks (weather, seasonality, holidays). Standard errors clustered at the station level. Treatment defined as BIXI stations within 500m of a new REM station.
Results
| Event | Treated stations | Effect estimate | 95% CI | p-value |
|---|---|---|---|---|
| South Shore (Jul 2023) | 15 | +10.4% | −5.7% to +29.2% | 0.22 |
| Deux-Montagnes (Nov 2025) | 37 | +2.7% | −11.5% to +19.1% | 0.73 |
Both point estimates are positive, consistent with transit complementarity. Neither is statistically distinguishable from zero at conventional thresholds, which reflects genuine uncertainty at this station-level resolution rather than a failure of the design.
Caveats
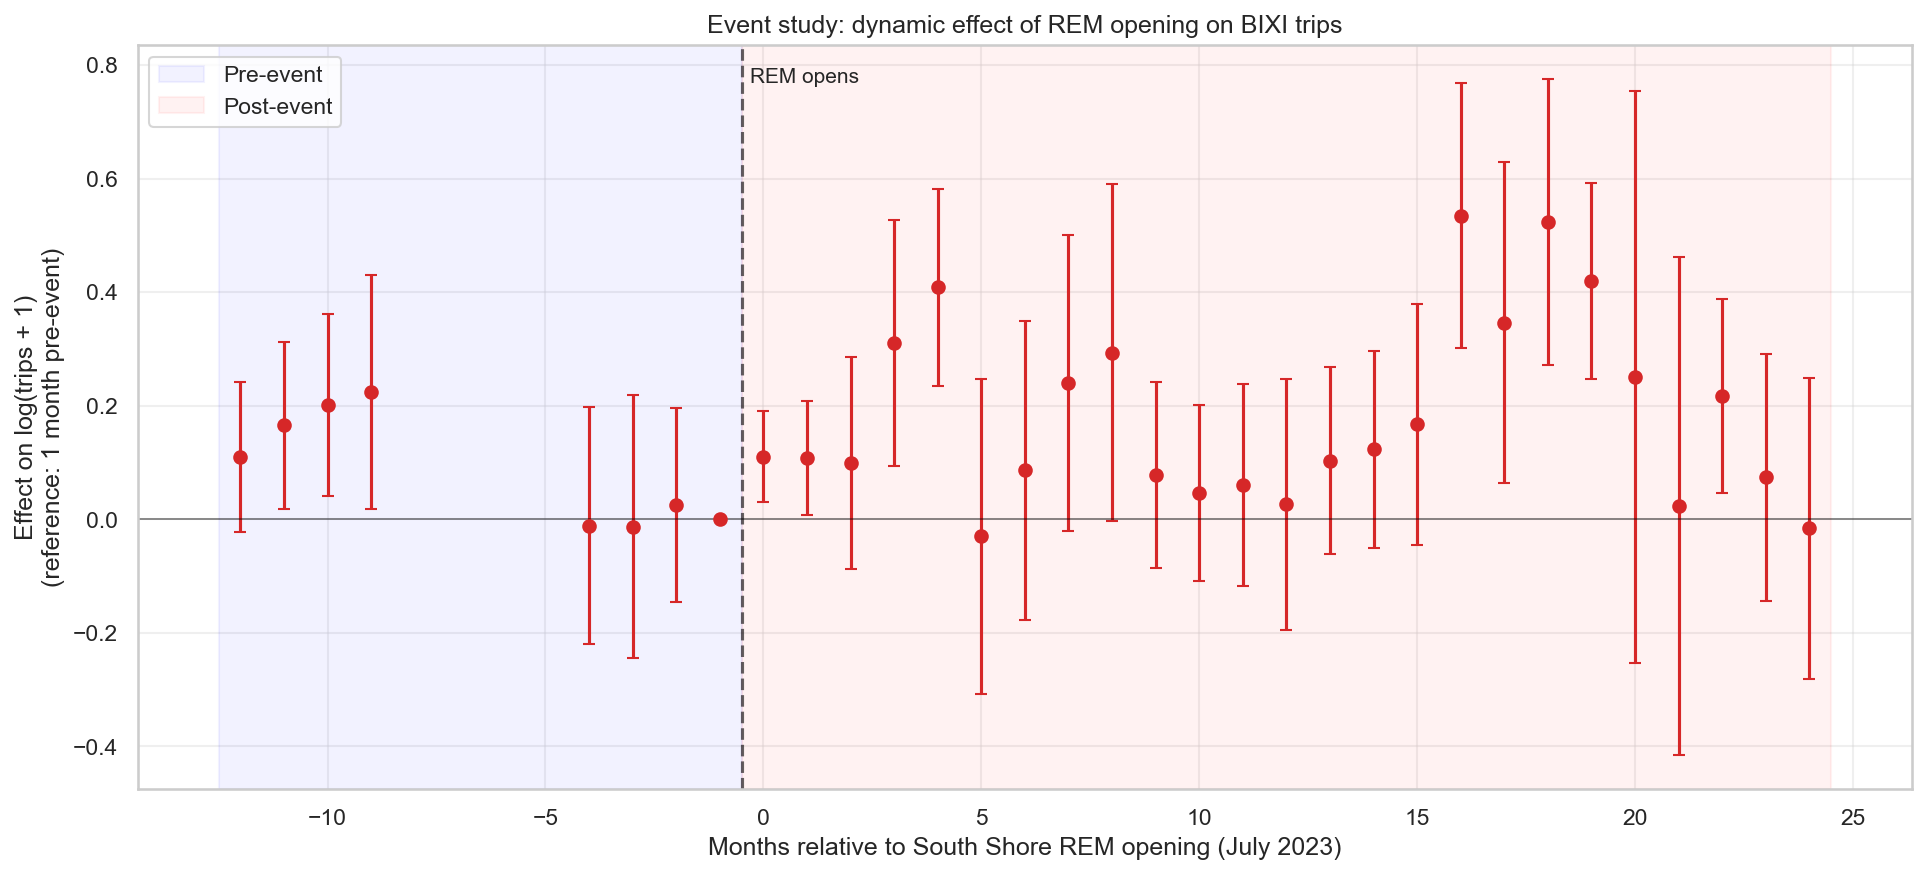
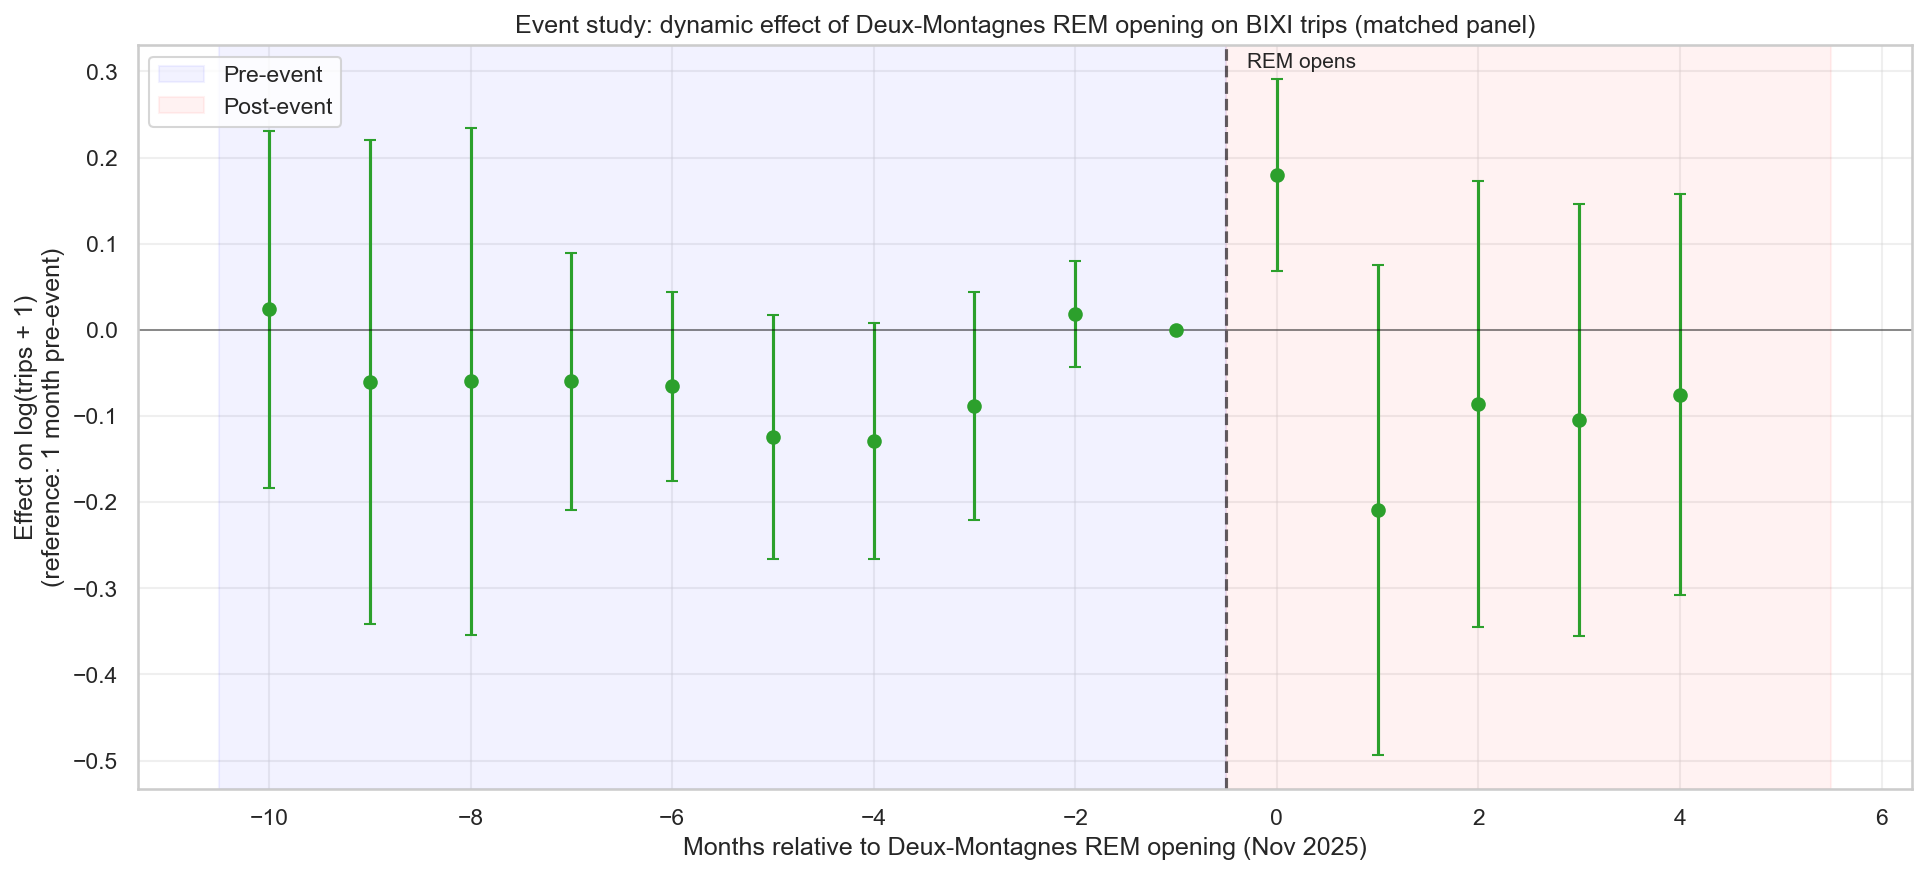
The treated samples are small: 15 stations for South Shore, 37 for Deux-Montagnes. The South Shore event study shows some pre-trend heterogeneity in summer 2022 (non-zero pre-event coefficients), suggesting matching only partially balanced the comparison and weakening the identifying assumption for that event. The Deux-Montagnes matched event study shows clean parallel trends throughout the pre-period.
The Deux-Montagnes post-event window is also short (~6 months as of analysis date), making gradually-emerging network effects harder to detect.
What this study cannot settle
The direction of the effect is complementarity in both events, and that consistency across two independent natural experiments is meaningful. But the confidence intervals are wide, and this study cannot determine whether the positive effects are real or noise. More power would tighten the picture: a third REM opening, a joint stacked event study, or longer post-event windows.
What’s next
- Stack both events into a joint event study to roughly double effective sample size
- Add an ML counterfactual (gradient-boosted trees on pre-event data) as an independent robustness check
- Re-run when the Anse-à-l’Orme branch opens for a third treated cluster
- Extend to STM bus and metro ridership where available for a full multimodal picture
Technical Notes
- Data: BIXI open data (trip-level records); STM GTFS (open data)
- Processing: chunked Pandas, coordinate-based station deduplication
- Matching: scikit-learn NearestNeighbors, k=5, on standardised log pre-period trips + latitude + longitude
- Estimation: linearmodels PanelOLS, two-way FE, station-clustered SE